Paula Radcliffe is an English marathon runner who earned countless accolades over the course of her career, which ended in 2015. Between 2002 and 2008, she won the London and New York Marathons three times each, and the Chicago Marathon once. She set the still-standing women’s world record for the marathon in London in 2013, with a time of 2:15:25. During the four years leading up to setting this record, Radcliffe did not improve her maximal oxygen uptake (VO2max), which is widely considered the best measure of cardiorespiratory fitness.
How is this possible? Instead of working to improve her VO2max, Radcliffe focused her training on increasing her lactate threshold (LT) from 80 to 88 percent of VO2max. This yielded a subsequent increase in maximal lactate steady state (MLSS) (Coyle, 2007). Remember, endurance performance is influenced not only by LT and VO2max, but also by the ability to exercise at a high percentage of VO2max over a prolonged period of time. The relationship between LT and endurance performance is of particular interest to coaches and athletes because it provides an indicator of muscular fatigue and performance ability. A more specific marker of performance ability is MLSS, which occurs slightly above LT and refers to the highest level of exercise intensity that can be maintained over time without continual blood lactate accumulation. In practical terms, it marks the intensity that can be sustained for approximately 60 minutes. If an athlete can improve MLSS, he or she will theoretically also improve the pace that can be maintained during competition.
Theoretical Basis for the ACE Integrated Fitness Training® Model
The ACE Integrated Fitness Training® (ACE IFT®) Model was designed to optimize cardiorespiratory training for clients with a wide range of goals and abilities. A key component of the ACE IFT Model is the identification of, and subsequent training relative to, the first and second ventilatory thresholds (VT1 and VT2). Ventilatory markers, which are often used as markers of lactate in the blood, can be used to program training intensity.
During an incremental exercise test with direct gas and blood analysis, there are distinct patterns for ventilation and lactate. In the beginning stages of incremental exercise, ventilation rises in a linear fashion. As exercise intensity progresses, ventilation will break from linearity. This break point is termed the VT1. This point corresponds with the LT, or where lactate first increases 1 mmol/L above resting values. As the body switches from burning primarily fats to primarily carbohydrates, there is an increase in lactic acid production and a reduction in lactate removal, leading to a subsequent increase in carbon dioxide (CO2) produced from the bicarbonate buffering system. VT1 marks the increase in minute ventilation (VE) that is required to expel the excess CO2.
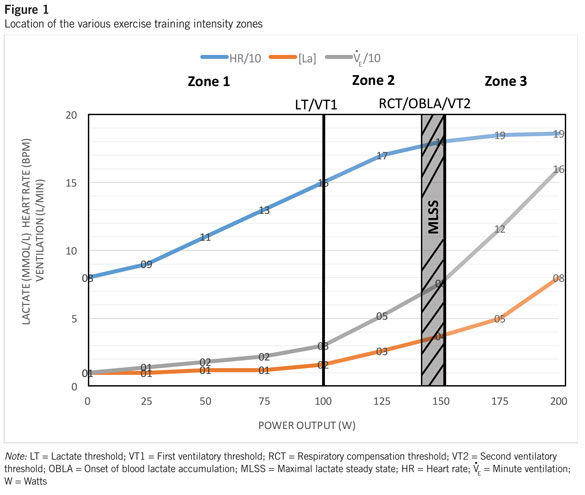
As exercise intensity continues to rise, the buffering system cannot keep up, acid accumulates and blood pH begins to fall. As a result of the fall in blood pH, the chemoreceptors in the respiratory control system are stimulated, resulting in another non-linear break in VE. This second breakpoint is termed VT2, which is also referred to as the respiratory compensation threshold (RCT). Soon after this occurs, the exerciser will have to reduce intensity to continue without fatigue because lactate levels begin to rise exponentially in the blood. Some people also call this point the onset of blood lactate accumulation (OBLA), because at this point excess lactate cannot be buffered and begins to accumulate in the blood. MLSS (remember, this stands for “maximal lactate steady state”) occurs just prior to RCT. Dekerle et al. (2003) estimated that MLSS equals RCT minus 10% of VO2max. Because identifying MLSS requires frequent blood sampling, many researchers rely on gas analysis to identify RCT, and can then reasonably deduce where MLSS occurs (Figure 1).
Obtaining the Respiratory Compensation Threshold Using the Talk Test
Traditionally, the best way to obtain values for ventilatory thresholds has been through direct gas analysis during incremental exercise tests. However, these tests can only be performed in laboratories with specialized equipment and experienced personnel to administer the tests. Over the past several years, the talk test (TT) has been established as a valid and reliable surrogate for identifying both VT1 (Zanettini et al., 2013; Foster et al., 2008; Dehart-Beverly et al., 2000) and VT2/RCT (Schroeder et al., 2017; Rodriquez-Marroyo et al., 2013; Recalde et al., 2002).
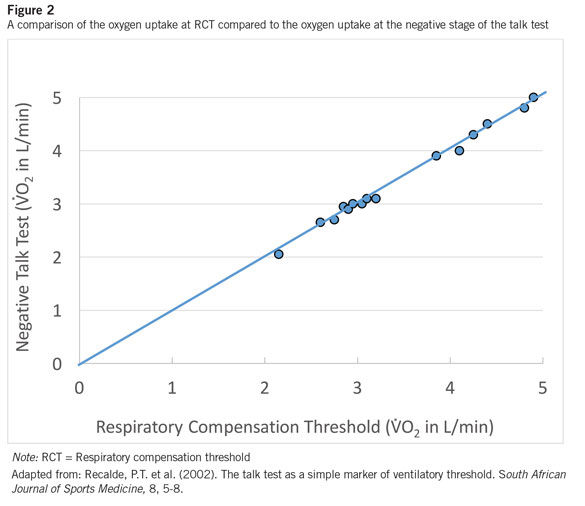
Recalde et al. (2002) demonstrated that the negative stage of the TT (NEG stage), where the response to the question, “Can you speak comfortably?” is a flat “No,” corresponded with RCT. Subjects were 16 well-trained adults with an average VO2max of 50.8 mL/kg/min. Subjects completed either a treadmill or cycle ergometer test with three-minute stages and recited the Pledge of Allegiance (31 words) at the end of each stage of the TT. The study compared gas analysis identification of RCT to TT responses. It was determined that there was no significant difference between VO2 at the NEG stage of the TT (3.38 ± 0.81 L/min) and RCT (3.42 ± 0.84 L/min), demonstrating that RCT could reliably be identified using the TT (Figure 2). This is important to highlight, as until relatively recently the data were not available to validate the use of the TT to identify RCT, but the evidence is now clear. The research has confirmed the physiological relationships over the past decade, proving that field tests for oxygen consumption, such as the TT, are adequate even for the most elite athletes.
 How Does Spending Time Above RCT Improve Performance?
The physiological mechanisms behind improved endurance performance as a result of time spent above RCT can be quite complex. However, it can be broken down into two mechanisms: (1) the body’s ability to create energy aerobically and (2) enhanced clearance of lactate in working muscles.
Training at higher intensities over time results in increased mitochondria size and number and mitochondrial enzymes in the muscles, resulting in improved fat oxidation. Improving utilization of aerobic pathways results in an overall decrease in lactate production and subsequent accumulation of lactate. Additionally, training at higher intensity increases both the number of muscles recruited and the capillary density in those muscles. This leads to increased intermuscular lactate utilization and improved lactate removal; hence, enhanced lactate clearance. If nutrition and health are optimal, then the athlete should see an improvement in performance by spending 10 to 20% of training time above RCT.
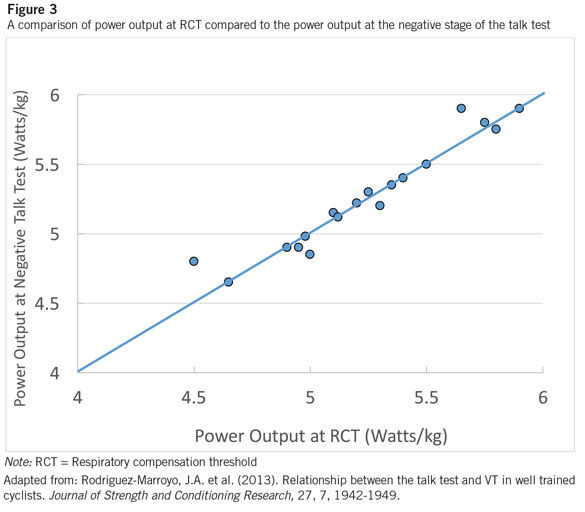
Rodriguez-Marroyo et al. (2013) confirmed the previous findings of Recalde et al. (2002). Subjects were 18 elite road cyclists with an average VO2max of 73.8 ± 2.8 mL/kg/min. The study used two-minute stages and subjects recited a 38-word Spanish poem as the TT passage. There was no significant difference between the workload at RCT (5.3 ± 0.4 W/kg) and the NEG stage (5.3 ± 0.5 W/kg) of the TT (Figure 3). Additionally, significant relationships between RCT and the NEG stage were found for workload (r = 0.94), heart rate (HR) (r = 0.92) and ratings of perceived exertion (r = 0.88), confirming that the TT could be used to non-invasively identify RCT. Rodriguez also reported that RCT occurred at 81.6 percent of VO2max, which agrees with other values reported in the literature (Dekerle et al. 2003).
Most recently, Schroeder et al. (2017) conducted a study evaluating the relationship between speech passage length used during the TT and identification of RCT. Subjects were 18 moderately active adults with an average VO2max of approximately 43 mL/kg/min. The study used two-minute stages during a cycle ergometer protocol and compared power output (PO) at RCT to TT responses using passages that were 31, 62 and 93 words in length (the Pledge of Allegiance was repeated one, two or three times). The researchers found no significant difference between PO at RCT (175 ± 39.06 watts) and the NEG stage (173.6 ± 38.80 watts) of the TT during the 93-word condition (Figure 4).
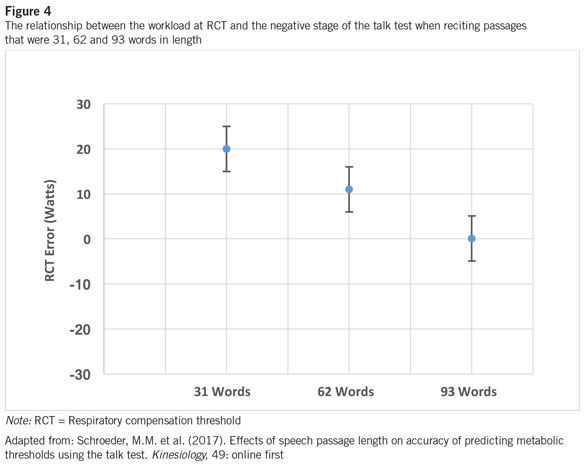
These results suggest that using a longer speech passage may more accurately identify RCT when using a two-minute stage cycling protocol. We hypothesize that using a longer speech passage requires subjects to answer more accurately. It takes longer to recite and does not allow the subject to rush through the passage with one breath, which may give a false estimate of the ability to talk, and thus an overestimation of PO at RCT.
Our laboratory has utilized both two- and three-minute stage protocols when administering the TT with comparable results. An analysis of the literature by Bentley, Newell and Bishop (2007) demonstrated that incremental tests using three-minute stages provide the most reliable measures of endurance performance in trained athletes. However, using stages that last less than three minutes with untrained individuals may compromise maximal PO and VO2max due to a lack of muscular endurance or motivation. Therefore, we recommend using stages of about two minutes for untrained individuals and longer stages for trained individuals to most accurately predict threshold values.
Training and Performance Implications
Over the past decade, submaximal metabolic inflection points and their associated HRs have led to the development of three training-zone intensities (Esteve-Lanao et al., 2005). These zones are also consistent with the ACE IFT Model. Intensities at HRs below VT1/LT are categorized as zone 1, while intensity spent at HRs above VT2/RCT are zone 3. Intensities at HRs in between VT1 and VT2 (around MLSS) correspond to Zone 2 (see Figure 1).
An essential component to improving endurance performance is training intensity and its distribution throughout the training process. When evaluating elite athletes, it appears that they follow a polarized training model, where they spend the majority of their training time in zone 1 (~75 percent) or in zone 3 (15-20 percent), and little time in zone 2 (Seiler and Kjerland, 2006). This is also consistent with the ACE IFT Model, where is it recommended that 70 to 80% of training be in zone 1; <10% in zone 2; and 10 to 20% in zone 3. Additionally, when evaluating performance, it appears that events lasting less than one hour can be accomplished at intensities close to RCT, near MLSS. Events lasting greater than one hour will be accomplished at intensities associated with VT1, which is slightly less than MLSS (Laursen et al., 2005).
Conclusion
The TT provides an easy and noninvasive way for coaches and researchers to accurately identify training variables and markers of performance. Our laboratory has demonstrated that the NEG stage of the TT correlates well with RCT. Obtaining power, speed and HR associated with VT1 and RCT can help coaches titrate training regimens and quantify time spent in each training zone, helping to maximize training adaptations.
While the science presented in this article is rather complex, there are some clear and practical implications for health and fitness professionals who are training athletes. Athletes want to identify RCT and then exercise slightly above it—not for very long, as lactate accumulation will outpace the body’s ability to buffer it—and then come back down to exercise below it. Doing so will shift one’s RCT upward, which equates to a clear performance improvement. As RCT shifts upward, so does the MLSS, meaning that the ability to exercise at a higher intensity for 30 to 60 minutes has been improved. Remember, the MLSS is the point at which the body is able to remove lactate at the same rate at which it is producing it, meaning that this is the highest intensity at which the athlete is able to continue exercising or competing. Above that intensity level, lactate levels will increase and the individual will have to stop working.
One final note: Programming exercise based on RCT involves finding the individual’s HR associated with that threshold and then identifying appropriate zones in which that person should be training in order to improve performance. In other words, identifying an athlete’s HR at RCT allows you to offer truly individualized programming that will drive measurable, performance-enhancing results.
References
Bentley, D.J., Newell, J. & Bishop, D. (2007). Incremental exercise test design and analysis: Implications for performance diagnostics in endurance athletes. Sports Medicine, 37, 7, 575-586.
Coyle, E. (2007). Physiological regulation of marathon performance. Sports Medicine, 37, 4-5, 306-311.
Dehart-Beverly, M. et al. (2000). Relationship between the talk test and ventilatory threshold. Clinical Exercise Physiology, 2, 34-38.
Dekerle, J. et al. (2003). Maximal lactate steady state, respiratory compensation threshold and critical power. European Journal of Applied Physiology, 89, 281-288.
Esteve-Lanao J. et al. (2005). How do endurance runners actually train? Relationship with competition performance. Medicine & Science in Sports & Exercise, 37, 496-504.
Foster, C. et al. (2008). The talk test as a marker of exercise training intensity. Journal of Cardiopulmonary Rehabilitation and Prevention, 28, 24-30.
Laursen, P.B. et al. (2005). Relationship between laboratory-measured variables and heart rate during an ultra endurance triathlon. Journal of Sports Science, 23, 1111-1120.
Recalde, P.T. et al. (2002). The talk test as a simple marker of ventilatory threshold. South African Journal of Sports Medicine, 8, 5-8.
Rodriguez-Marroyo, J.A. et al. (2013). Relationship between the talk test and VT in well trained cyclists. Journal of Strength and Conditioning Research, 27, 7, 1942-1949.
Schroeder, M.M. et al. (2017). Effects of speech passage length on accuracy of predicting metabolic thresholds using the talk test. Kinesiology, 49: online first.
Seiler, K.S. & Kjerland, G.O. (2006). Quantifying training intensity distribution in elite endurance athletes: Is there evidence for “optimal” distribution? Scandinavian Journal of Medicine and Science in Sports, 16, 49-56.
Zanettini, R. et al. (2013). Validity of the talk test for exercise prescription after myocardial revascularization. European Journal of Preventive Cardiology, 20, 376-382.
Why Does ACE Sponsor Fitness-related Research Studies?
This study was sponsored by the American Council on Exercise. For more than 20 years, ACE has commissioned independent research studies from major universities and trusted partners across the country, covering everything from infomercial fitness products to the effectiveness of some of the hottest trends in health and fitness. ACE is committed to investing in these studies as part of its mission to promote the benefits of physical activity and to protect people from unsafe and ineffective fitness products and trends. You can find more information about past ACE-sponsored studies, including research on the best abdominal exercises, kettlebell workouts and Zumba, by clicking here.